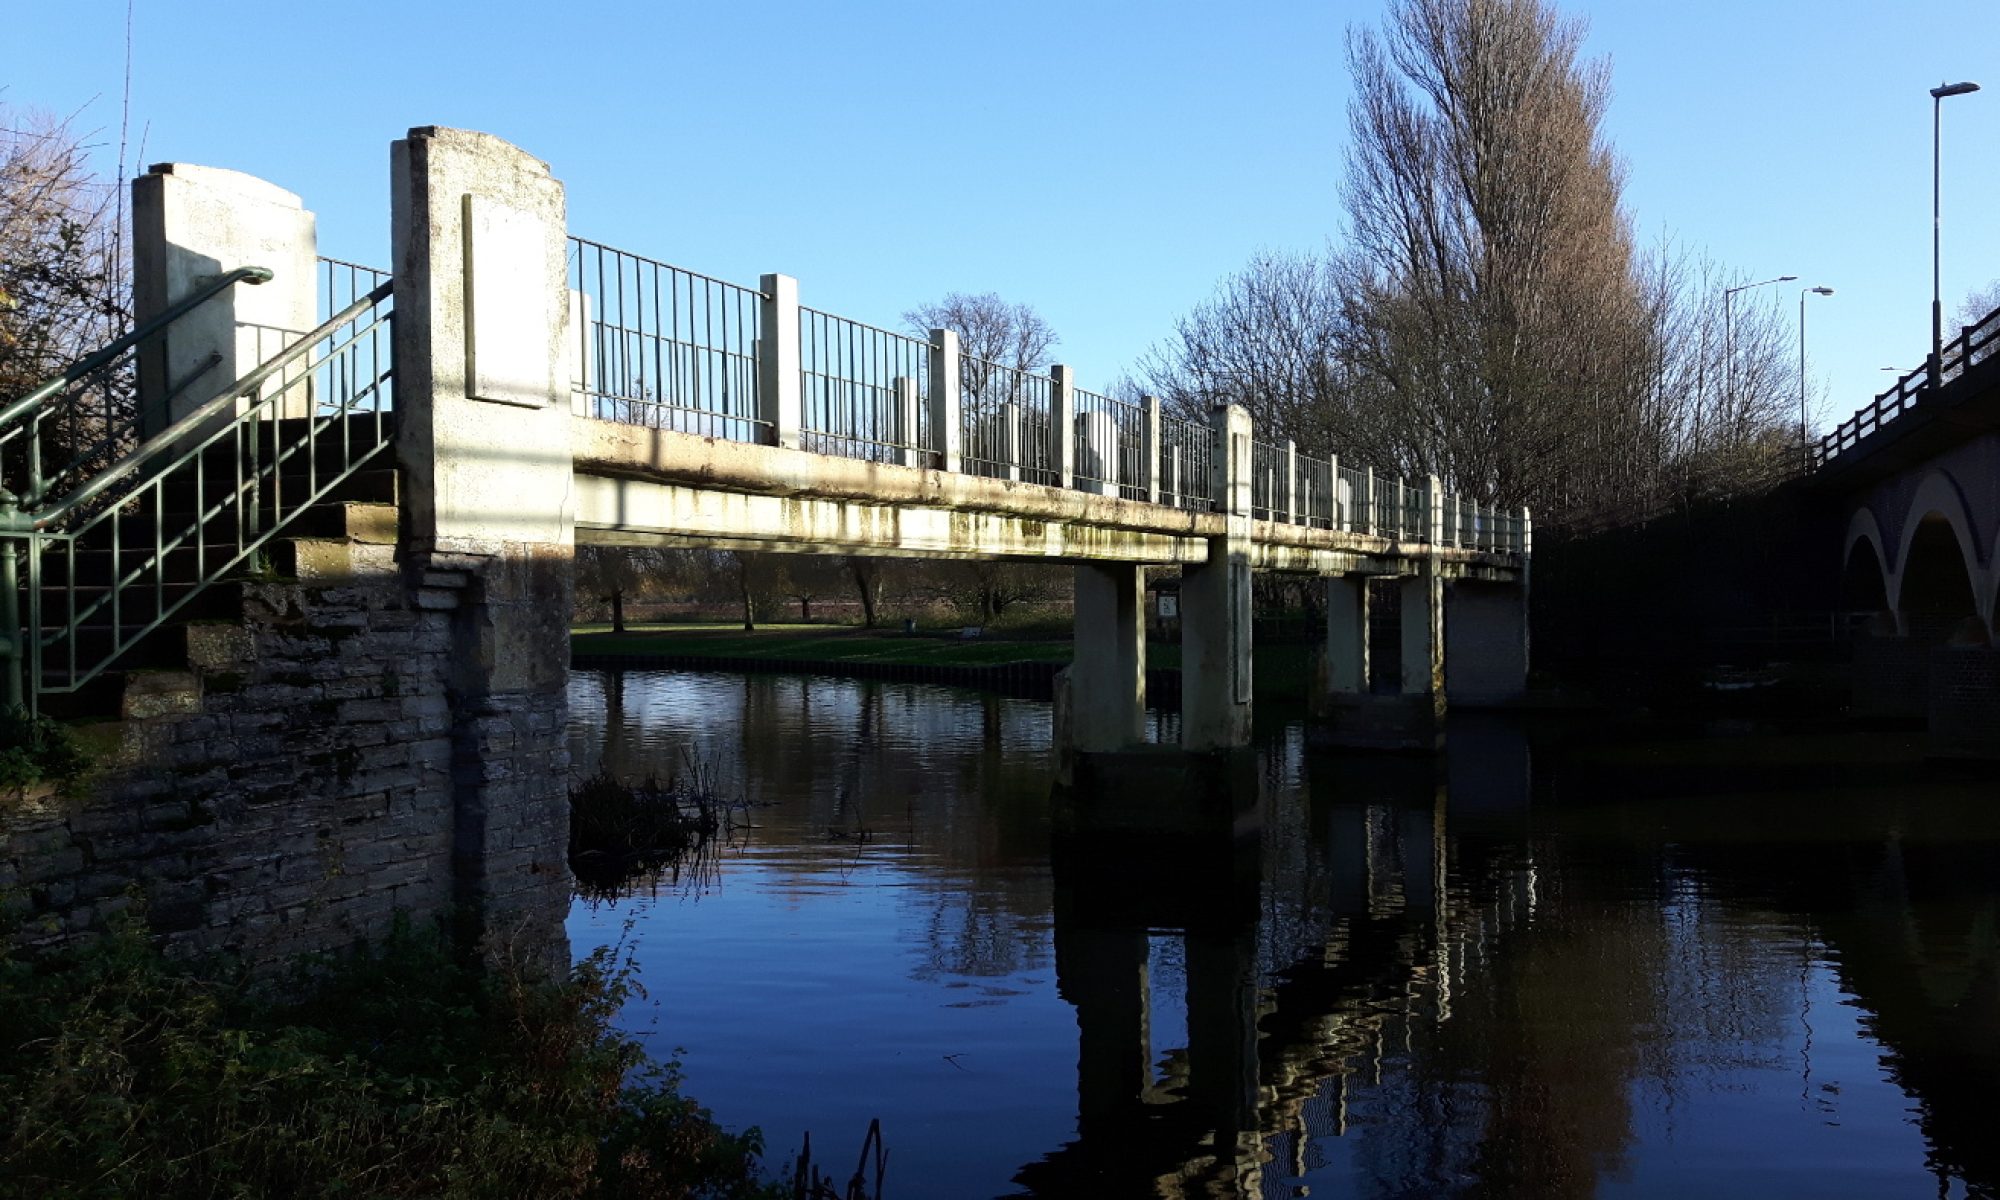
Seeing the Wood for the Trees – How many people presently use Lucy’s Mill Bridge – how many could?
We did some very specific surveying of how people presently use the bridge. We could have just counted numbers crossing, a very simple method. The most complicated way to find out about use would have been to have had questionnaires to give to people on the bridge, but that would have prevented people from going about how they normally use the bridge and we could only have taken a sample of the numbers of present users.
What we did do, was actually look at finding the richest data we could without intruding into people’s lives. We recorded where they came from to sue the bridge and where they left to go to, We gave them an age profile, and wrote down if they had a dog, bike, pushchair, whether it was difficult to cross – or whether they couldn’t. We recorded them as group ‘units’ – were they an individual, a couple, or where they a family?
That data, taken over each day of the week and including early mornings, the most popular times (around lunch) and then late in the day – it can be analysed and then sued to profile what type of people use the bridge and when.
All the results are here:
Summary report pdf’s – North side – South side
Detailed Counting Spreadsheets of People using Lucy’s Mill Bridge – North side – South side
This data can be combined into this model. Its something anyone can use. We’ve divided up Stratford into small areas, then found out how many people live in each one, and their age profiles. You can then decide on how and why they might use the bridge – and you can add more people to the bridge users if it were fully accessible. Its an excel spreadsheet – and you could send us your data interpretations once they are complete.
Please try this excel model we have used. Download zip file.
Making a Decision about Lucy’s Mill Bridge

